





Why a 96% Dental Collection Rate May Still Be a Problem
A dental practice can produce more, submit more claims, and receive more insurance payments. Yet it can still leave collectible revenue unresolved. That is why a strong collection number does not always mean the revenue cycle is performing well. The dental insurance collection rate helps practices measure how much collectible insurance revenue is actually being converted into payments. But the percentage alone can be misleading.
Production definitions can change what the number means. Contract changes can change it too. Payment timing can affect it. Claim status can affect it. Denials can affect it. Underpayments can affect it. Payment posting can affect it. A/R can affect it.For dental revenue cycle management teams, the goal should not simply be to push the percentage higher. The real goal is to understand what is driving it.
Start With the Right Production Figure
For overall practice performance, collection rate is commonly calculated as:
Collection Rate = Net Collections ÷ Adjusted Production × 100
The production figure used in the calculation is critical. Gross production shows the practice’s full fee schedule, but it may not match what it can collect. Contractual adjustments tied to insurance participation can significantly reduce the collectible amount.
Consider a practice with $150,000 in adjusted production and $144,000 in collections:
$144,000 ÷ $150,000 × 100 = 96%
The practice collected 96% of adjusted production.
That sounds strong, but the remaining 4% still needs an explanation. It may show unresolved claims, denials, or underpayments. It may also show aging A/R and unapplied payments. It may include incorrect adjustments or balances not yet ready for collection. The collection rate identifies a gap. It does not explain the gap. That distinction matters. If the real problem is claim aging, simply pushing the team to “collect more” will not solve the cause.
Measure Insurance Collections Separately
Overall collections usually combine insurance and patient payments. That can make the number less useful when the goal is to evaluate payer performance. A more focused calculation is:
Insurance Collection Rate = Net Insurance Collections ÷ Net Insurance Production × 100
Suppose a practice has $120,000 in net insurance production and receives $114,000 in net insurance collections:
$114,000 ÷ $120,000 × 100 = 95%,
The insurance collection rate is 95%.
The word net is important because the calculation should reflect what the practice is actually entitled to receive. Adjustments, refunds, write-offs, and other transactions can affect both sides of the formula. The methodology can also differ between practice management systems.
CareStack , for example, uses a transaction-based Insurance Collection Rate:
Insurance Collection Rate (TXN) = Net Insurance Collection (TXN) ÷ Net Insurance Production (TXN) × 100
Its methodology incorporates transaction activity such as insurance payments, refunds, collection adjustments, production adjustments, and write-offs. CareStack’s Help Center documents this approach. It defines Net Insurance Collection (TXN) as insurance payments received by transaction date, adjusted for collection adjustments, refunds, and transfers, and Net Insurance Production (TXN) as gross insurance production including write-offs and production adjustments. CareStack also offers a payment-date version of the same metric, which times refunds and collection adjustments differently.
This matters when comparing reports across providers, locations, or systems. Two reports may use the same KPI name while calculating it differently, sometimes even within the same system. This is not just a dental problem. Healthcare finance leaders have pushed for standard KPI definitions so every organization calculates metrics like net days in A/R and denial rate the same way. Before benchmarking performance, make sure the methodology is consistent.
Why Gross Production Can Distort the Picture
The impact of the production figure becomes clearer with a simple example.Suppose a practice reports:
- Gross production: $200,000
- Contractual adjustments: $50,000
- Adjusted production: $150,000
- Collections: $144,000
Measured against gross production:
$144,000 ÷ $200,000 × 100 = 72%
Measured against adjusted production:
$144,000 ÷ $150,000 × 100 = 96%
The practice did not collect more money. Only the production figure changed. The 72% calculation includes $50,000 in contractual adjustments as though that amount were uncollected revenue. Those adjustments still matter when reviewing payer contracts, reimbursement rates, and network participation. But they are not the same as unpaid collectible revenue.
For insurance-heavy practices, separating contractual write-offs from actual collection performance is essential. Otherwise, a reimbursement or contract issue can easily look like a dental RCM collection problem.
Production and Payments Rarely Happen in the Same Month
Timing is another reason the insurance collection rate can be difficult to interpret. The payer may not pay for a procedure completed at the end of March until April. A payment received in May may relate to treatment completed several months earlier. Claims can also take longer to pay because they require additional documentation, payer review, resubmission, or an appeal. That creates a mismatch between the production used in the calculation and the collections used in the calculation. It also explains why a monthly collection rate can sometimes exceed 100%.
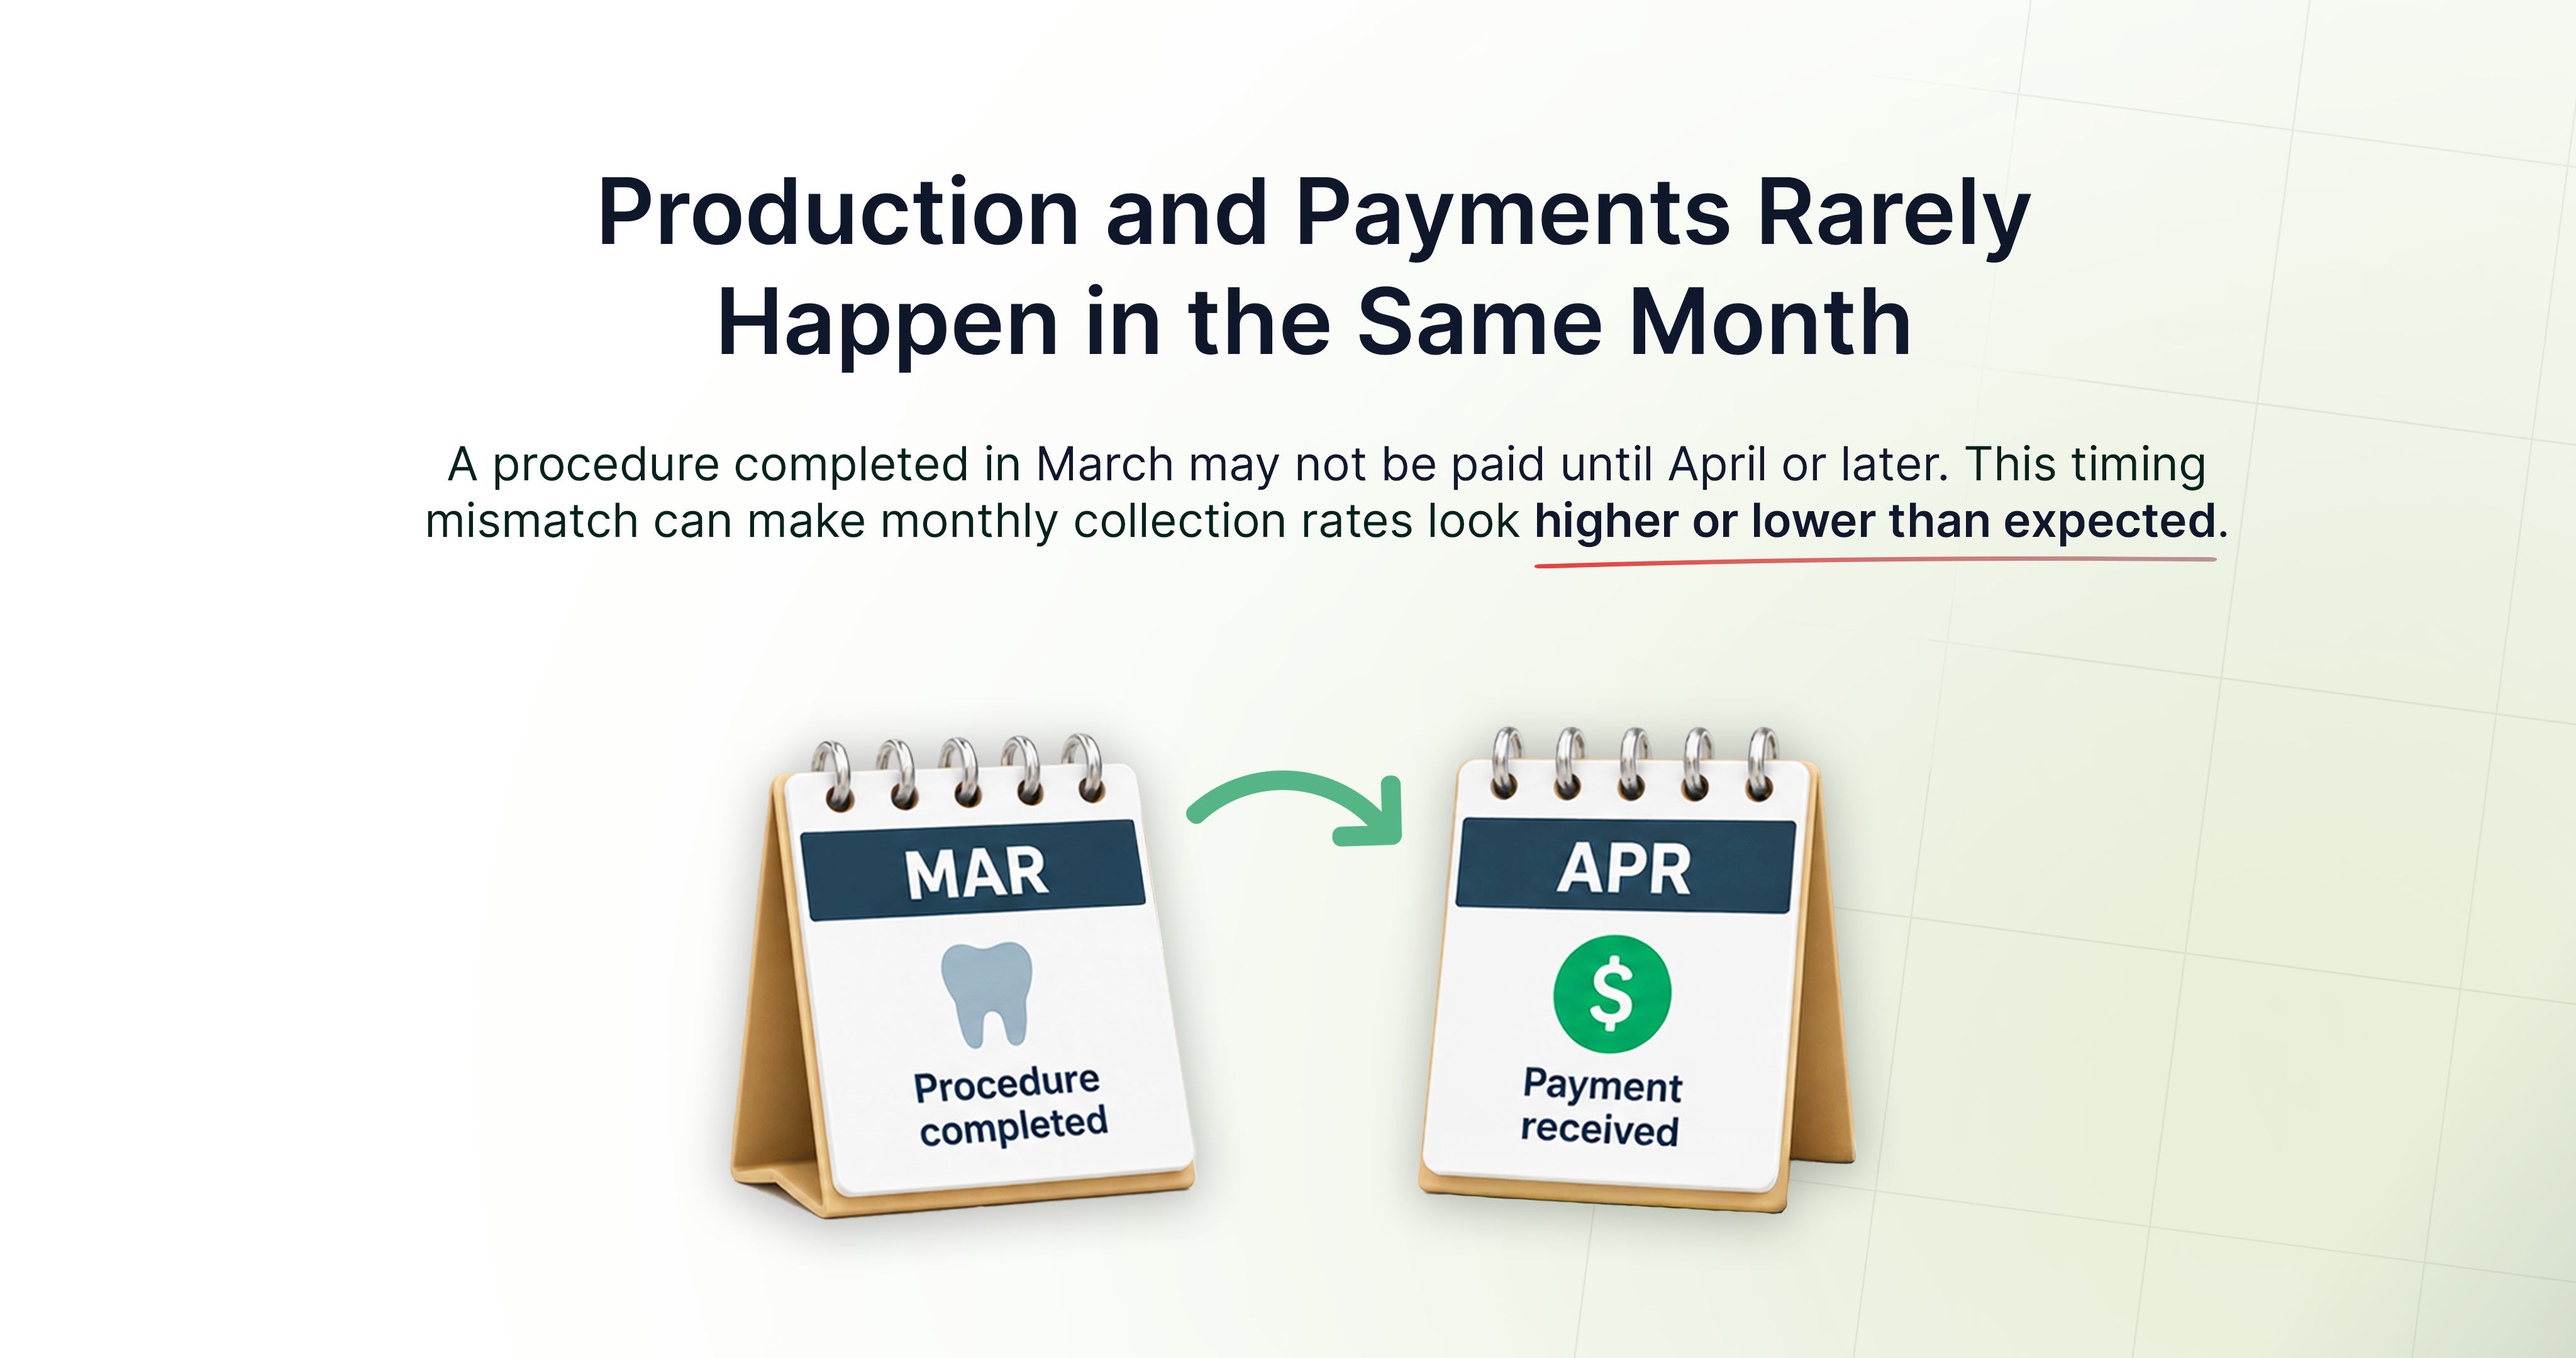
If a practice collects a large amount of older A/R in a month with low production, collections may exceed production. The opposite can happen too. A strong production month combined with delayed insurance payments can temporarily lower the collection rate. That is why you should never treat a single month's percentage as the full story. A rolling three-, six-, or twelve-month view provides a better indication of the underlying trend. Practices can go further by tracking the percentage of a production group they collect within 30, 60, 90, or more days. That shows whether the practice collects revenue and how quickly it moves through the revenue cycle.
What Is a Good Dental Insurance Collection Rate?
You’ve probably seen the ADA’s 98% benchmark thrown around. While collecting 98% of your adjusted production is a fantastic goal overall, holding your insurance claims to that exact standard is usually a recipe for frustration. Insurance is simply too complicated for a one-size-fits-all number. Your actual collection rate depends heavily on your specific payer mix, your PPO contracts, and how your practice software handles write-offs. Instead of obsessing over an industry average, figure out your own practice's baseline and pay close attention to which way it moves.
If your office normally collects 97% of your net insurance production and it quietly drops to 94%, that’s your cue to start asking questions. A 94% rate might not seem awful at first glance, but a sudden 3% dip means a gear in your billing machine just broke. In dental RCM, the trend line always tells a better story than a static number.
A High Collection Rate Can Still Hide Major Problems
A great collection percentage is nice to look at, but it can easily hide a completely broken billing process. Let’s look at two different dental offices that both boast a 96% insurance collection rate. The first office gets there without breaking a sweat. They verify benefits days before the appointment, send out perfectly clean claims, post payments right the first time, and keep their aging A/R totally clear.
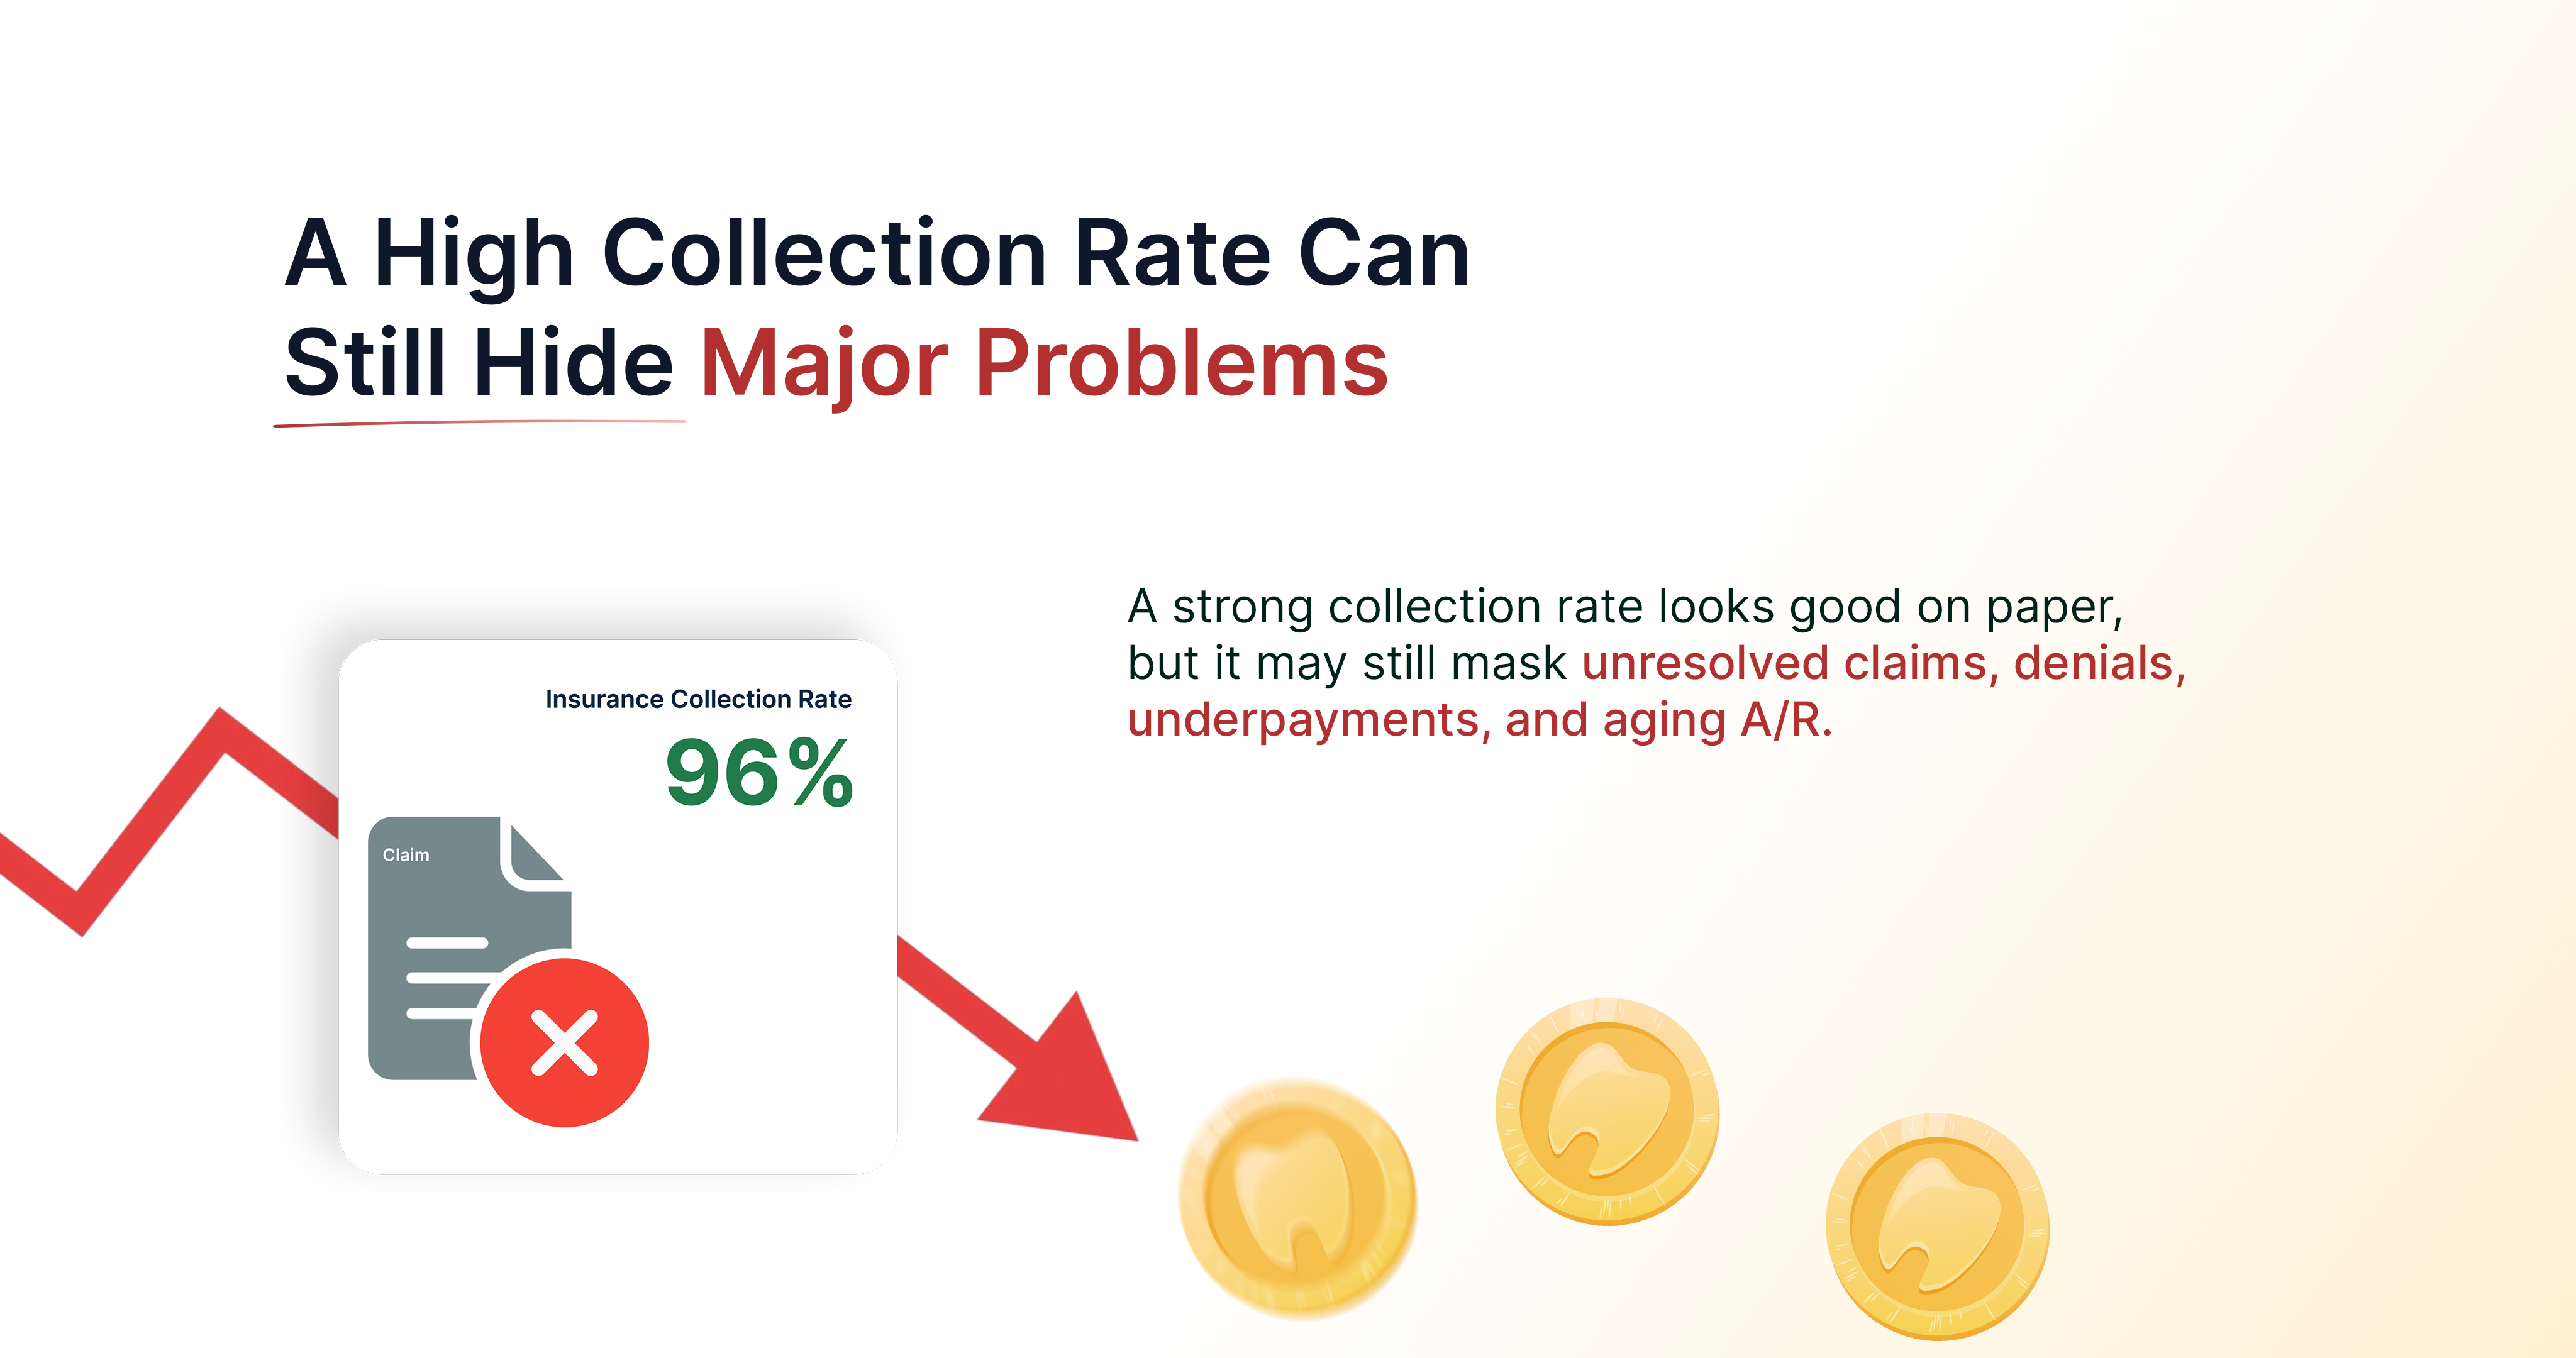
The second office also hits 96%, but it’s an absolute grind. Their front desk gets there by spending half the week on hold with insurance reps, resubmitting the same claims over and over, fighting endless appeals, and chasing money that is 90 days past due.
On a monthly financial report, both practices look identical. In reality, the second practice is bleeding time and burning out their staff. That’s why you can’t just look at what you collected, you have to look at how hard your team had to work to collect it. To see the full picture, you have to track the metrics going on behind the scenes:
- Insurance A/R Aging: Is your hard-earned money quietly gathering dust in the 60- or 90-day columns because no one has time to chase it down?
- Claim Aging: Do you know exactly which claims have vanished into the insurance company's processing black hole?
- Denial Trends: Are the same avoidable errors giving payers an easy excuse to reject your claims week after week?
- Underpayments: Are insurance companies shortchanging your contracted rates, just hoping your front desk is too swamped to notice the difference?
- Payment Posting: When the checks actually arrive, is your team applying the funds to the right accounts and untangling the messy write-off math without a hitch?
- Benefits Verification: Is your team spotting sneaky plan exclusions before the patient ever sits in the chair, or are you stuck playing the "treat now, pray it gets paid later" game?
When you track these specific areas, you finally see what's actually happening with your cash flow. A high collection rate might look amazing on a monthly dashboard, but it doesn't mean a thing if it hides a chaotic, exhausting billing process behind the scenes.
Collections Start Long Before the Payment Arrives
Insurance collection performance does not begin when the payment hits the bank. It begins much earlier. The payer can reject a claim submitted with incorrect information. Missing documentation can delay claim processing. An eligibility issue can turn into a denial or unexpected patient balance. If you don’t follow up on a claim promptly, it can remain in A/R far longer than it should.
Verification is also a growing administrative burden for dental offices. The 2024 CAQH Index found that spending on eligibility and benefit verification rose 15% to $2.1 billion, the largest increase among dental administrative tasks. The report tied part of that increase to the rising cost of checking benefits through payer portals.
That makes dental insurance claims billing services a direct part of collection performance. Effective claims billing involves more than submitting claims. It includes accurate claim preparation, timely submission, payer follow-up, and denial management. It also identifies recurring issues that prevent correct claim payment. The same is true for payment posting and A/R management.
A payment that is received but posted incorrectly can distort reporting. An underpayment that goes unnoticed can make the practice appear to have collected revenue when money is still unresolved. In many cases, the collection rate is the outcome. It depends on decisions and actions taken earlier in the revenue cycle.
What a Declining Collection Rate May Be Telling You
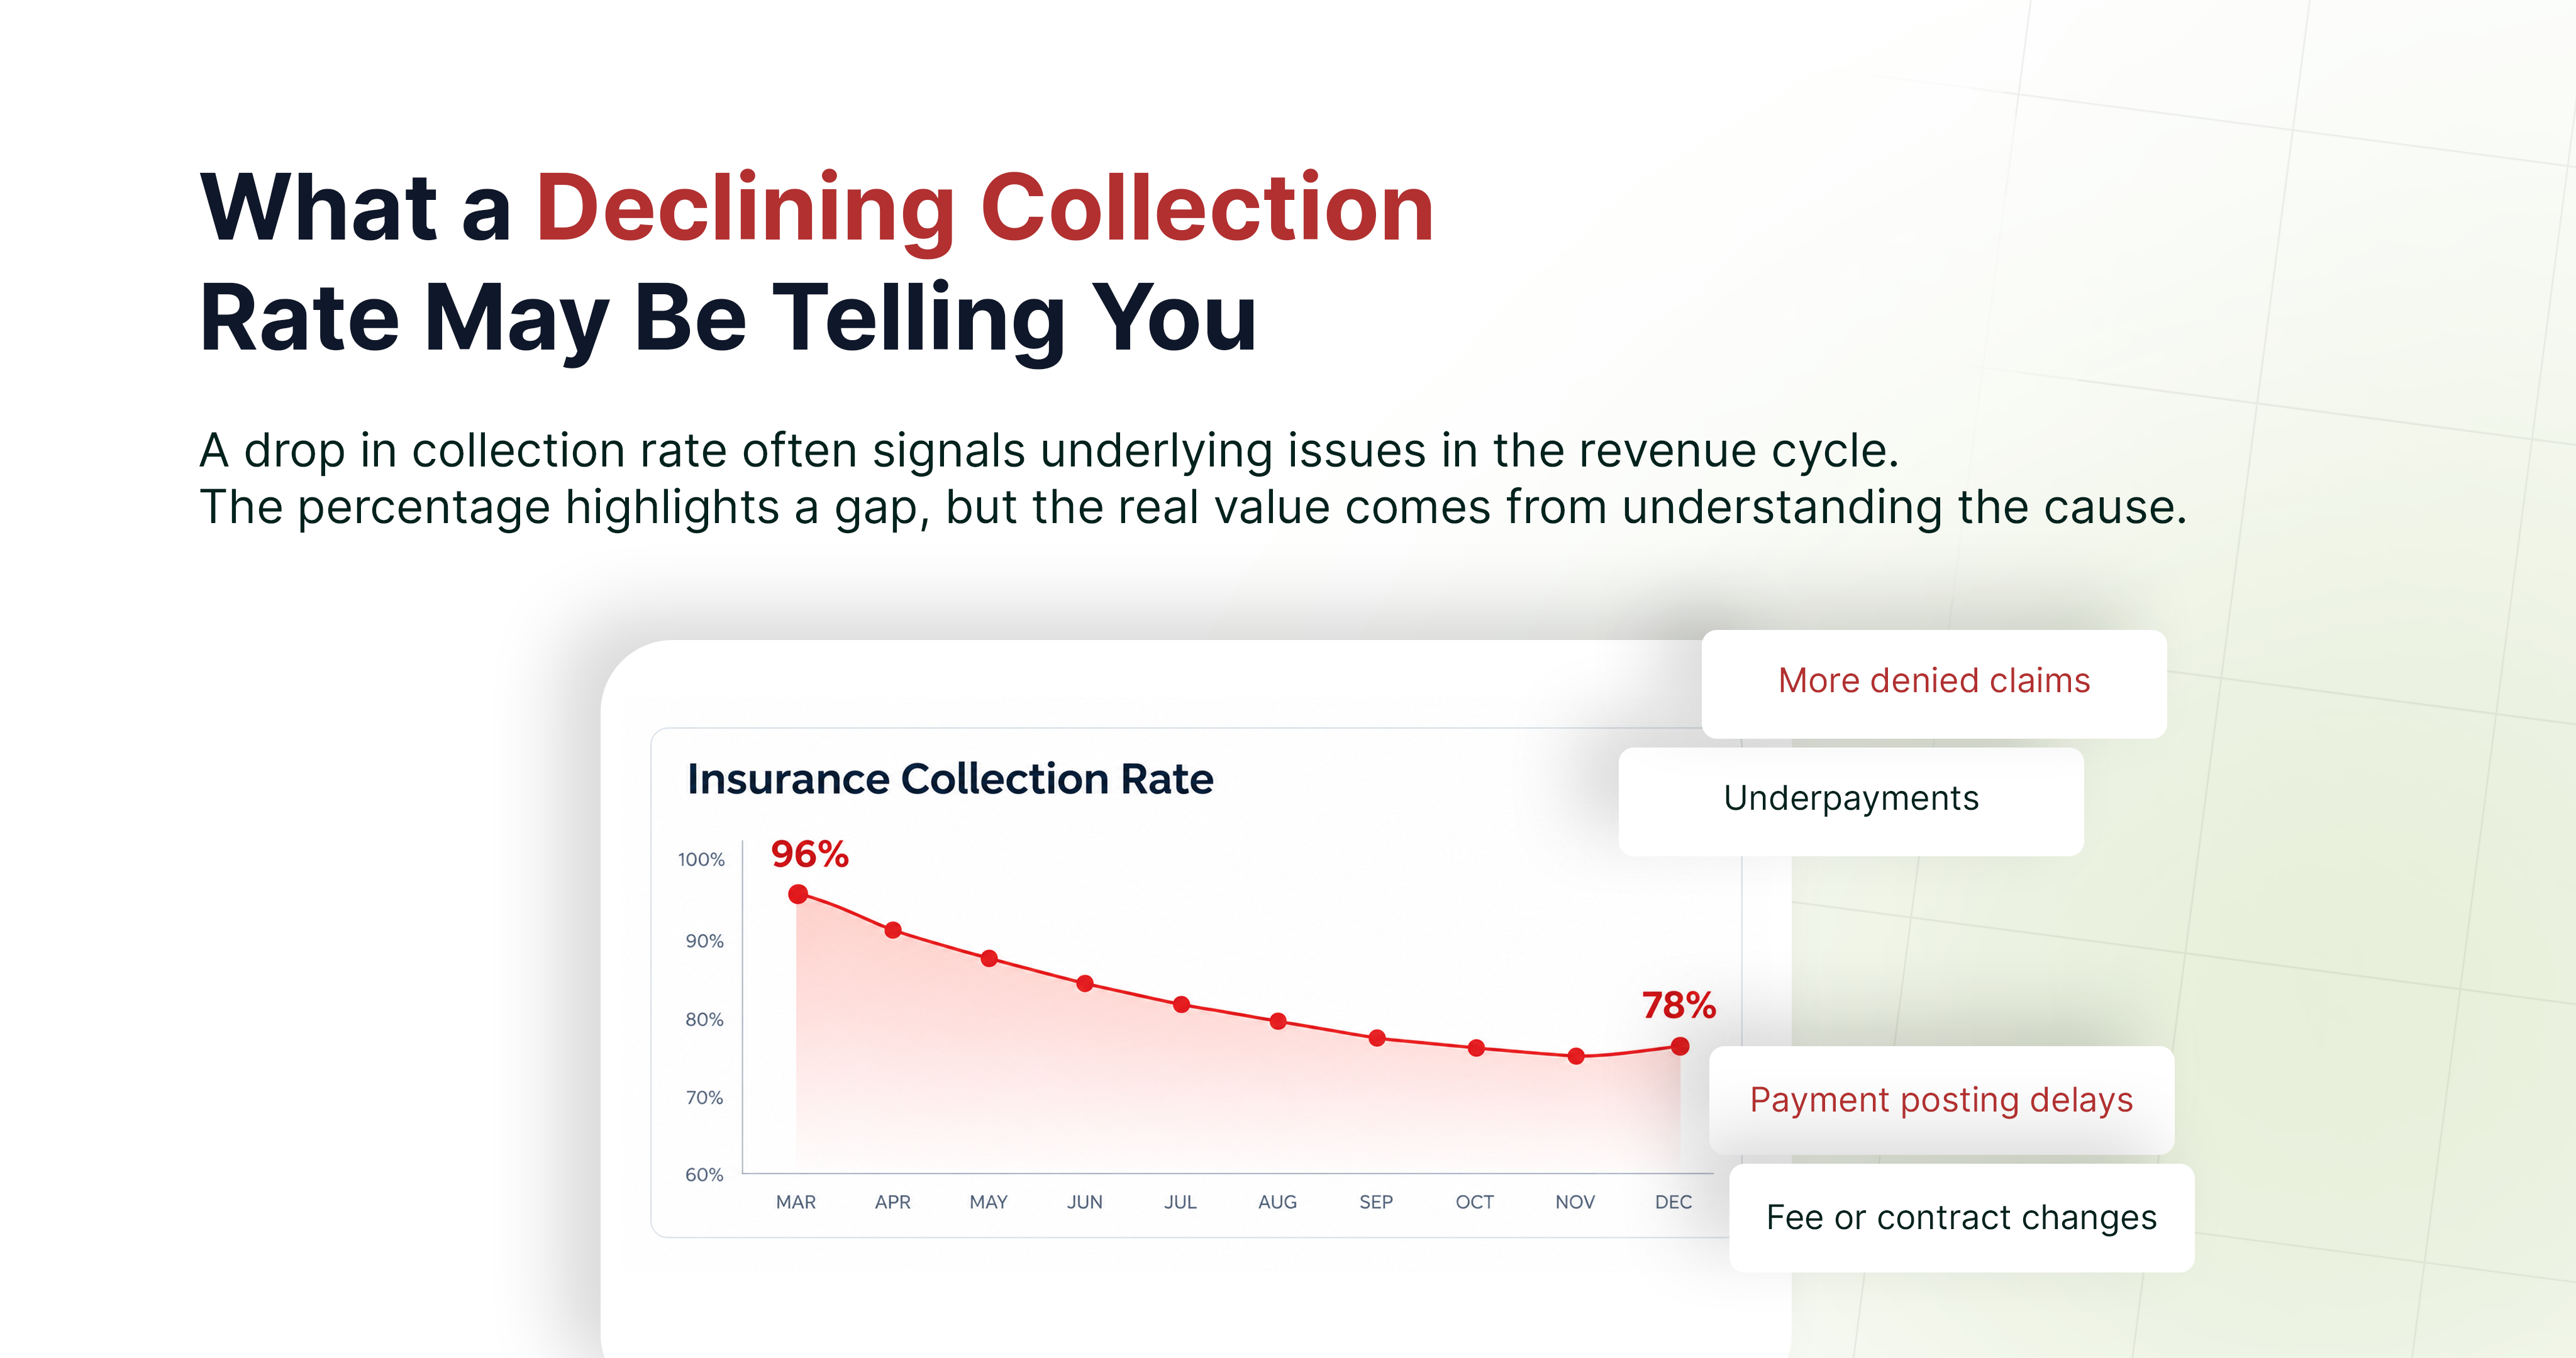
A declining insurance collection rate should trigger investigation, not an immediate conclusion. The issue could begin with eligibility and benefits verification. It could occur during claim submission because of incorrect information, missing documentation, or timely filing issues. It could happen after claim processing through denials, unresolved payer requests, missed underpayments, or incomplete appeals. It could even be a reporting problem caused by incorrect payment posting or adjustments.
The better RCM question is not: “Why are collections down?”
It is: “Where do we delay, reduce, or lose collectible revenue?”
That question moves the focus from the percentage to the process behind it.
Connect With CareRevenue
Your collection rate is a great baseline, but it rarely tells the whole story of your practice's financial health. CareRevenue manages all the messy, time-consuming work that actually drives that number. We take the heavy lifting completely off your plate from navigating complex benefit verifications and dropping clean claims, to chasing down stubborn denials and cleaning up your aging A/R.
Your collections might look decent on paper, but if the money is trickling in too slowly, your A/R is creeping up, or your front desk is burning out from fighting with insurance reps all day, something in your workflow is broken. If that hits home, it’s time to look a little deeper. CareRevenue pinpoints exactly where your revenue is bottlenecking and helps you build a billing machine you can actually depend on.
Turn the Percentage Into a Management Tool
The formula is simple:
Insurance Collection Rate = Net Insurance Collections ÷ Net Insurance Production × 100
The difficult part is interpreting the result correctly. Use a consistent definition of production and collections. Separate insurance performance from patient collections. Account for adjustments and other relevant transactions. Avoid judging performance based on a single month. Review collection rate alongside A/R, claim aging, denials, underpayments, payment posting, and eligibility.
“Most importantly, use the percentage to ask better questions.”
A collection rate can tell you that something changed. The rest of the revenue cycle tells you why. For practices investing in dental RCM services, that distinction is critical. The objective is not simply to report a higher collection percentage. We need to identify where the company delays, reduces, or loses collectible revenue and fix the process that causes it. That is what turns a collection rate from a report number into a practical dental revenue cycle management metric.
Curious about what's really driving your numbers?
Let’s talk. Connect with one of our RCM experts to audit your current revenue cycle, find the hidden leaks, and build a real strategy to speed up your payments and protect your cash flow.
Talk to our RCM Expert →
See Related Blogs
